


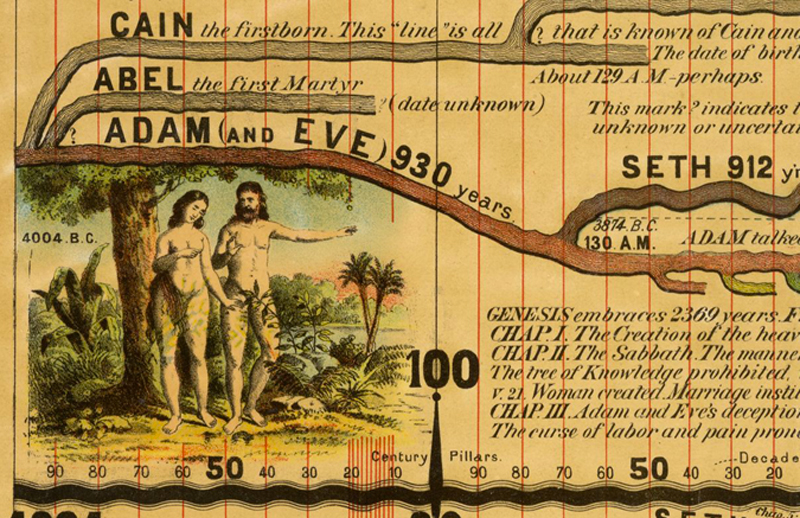
Note: Click on the chart below to zoom in at full size. Please allow large file to render.
Adams Synchronological Chart. Twenty-three-foot-long chart showing 5,885 years of history, from 4004 B.C. to 1881 A.D. First issued in 1871, Adams put out several editions in many formats.
The Synchronological Chart or Map of History, meticulously crafted by Sebastian C. Adams in the mid-19th century, represents an ambitious attempt to visually encapsulate the complex narrative of human history. This monumental work, a product of its era’s fascination with the organization and categorization of knowledge, stands as a testament to the intellectual spirit of the time. The Story Retold will delve into the creation, significance, and historical context of the Chart, providing an overview of its structure, content, and the debates it has inspired. We will examine the Chart’s contributions to the field of historical representation and consider the ways in which it reflects and shapes our understanding of the past.
The Genesis of the Synchronological Chart
Sebastian C. Adams (1820-1878), an American educator and historian, conceived the idea of a visual representation of historical data to aid in the comprehension of temporal relationships between civilizations and events. His Chart, published in 1871, was the culmination of a decade of research and compilation. It was a response to the burgeoning interest in historical studies and the recognition that traditional linear timelines were inadequate for conveying the interconnectedness of global history.
The Chart’s Structure and Content
Adams’ Synchronological Chart is a sprawling, color-coded wall chart that measures approximately 10 feet in length and 3 feet in height. It is divided into five horizontal sections, each representing a major era of world history: Ancient History, Mediaeval History, Modern History, and the Histories of the United States and Europe. Within these sections, the Chart organizes historical information into vertical columns, which align parallel civilizations and empires according to their periods of dominance. This synchronic approach allows viewers to compare and contrast historical developments across different regions simultaneously.
The Chart incorporates a vast array of data, including major events, political leaders, religious milestones, scientific discoveries, and cultural achievements. It draws from a plethora of sources, reflecting the scholarly consensus of the time. Notable features include a detailed key, a list of monarchs and presidents, and a chronological index that facilitates cross-referencing.
Importance and Influence
The Synchronological Chart was a groundbreaking tool for its time, offering educators and students a new way to engage with history. It embodied the Victorian era’s penchant for synthesizing knowledge into comprehensive and visually appealing formats, such as the famous “outlines” of history by James Ussher and the later historical atlases. The Chart’s importance lies in its innovative approach to historical education, which emphasized the interdependence of civilizations and the value of a comparative perspective.
Adams’ work reflected the era’s spirit of progress and belief in the unity of human history. It showcased the advancement of knowledge and the shared human experience, fostering a sense of global citizenship and intellectual curiosity. The Chart’s visual representation of historical data made it accessible to a broader audience, contributing to the democratization of historical knowledge.
Critique and Legacy
While the Synchronological Chart was celebrated for its innovation and educational value, it also faced criticism for its Eurocentric bias and its attempt to impose a linear narrative upon the intricate web of historical events. The Chart’s emphasis on Western civilization and its colonialist view of non-European histories underscores the limitations of historical scholarship during the 19th century.
Despite these criticisms, the Chart has had a lasting impact on the field of historical representation. It has inspired subsequent generations of historians and educators to develop new visual tools that grapple with the challenge of depicting the past in an inclusive and nuanced manner. Moreover, it serves as a reminder of the evolving nature of historical knowledge and the importance of critical analysis in interpreting historical sources.
“The Synchronological Chart is a mirror of its time, reflecting the biases and aspirations of the Victorian era, while simultaneously providing a foundation for the development of more sophisticated and inclusive methods of historical representation.”
Historical Context
The Chart emerged during a period of intense interest in historical scholarship, driven by the Enlightenment’s emphasis on reason and empirical evidence. The 19th century saw the rise of academic disciplines such as archaeology, anthropology, and historiography, which provided new insights into the past. The era also witnessed significant advancements in print technology, enabling the mass production and dissemination of educational materials like the Chart.
Adams’ Chart must be understood within the context of the Victorian fascination with progress, as well as the burgeoning nationalism that informed the American educational system post-Civil War. The Chart’s focus on the rise and fall of empires and the inexorable march toward Western dominance echoes the prevailing view of history as a story of linear development toward an inevitable end point.
Sources and Quotations
To provide a more thorough understanding of the Chart, we draw upon primary sources such as the Chart itself and contemporary reviews, as well as secondary sources that analyze its significance:
- Sebastian C. Adams, A Synchronological Chart or Map of History: Ancient, Mediaeval, and Modern (Boston: William Spooner, 1871).
- The Educational Review, Volume 1, No. 5 (May 1873): “A Synchronological Chart of History.”
- Daniel Rosenberg and Anthony Grafton, “Cartographies of Time: A History of the Timeline” (Princeton Architectural Press, 2010).
Composite: Adams’ Synchronological Chart
A composite of the entire Adams’ Synchronological Chart is available to view at full resolution from The David Rumsey Map Collection.
Discussion
The Synchronological Chart of Sebastian C. Adams remains a fascinating artifact of historical pedagogy. It raises important questions about the ways in which we choose to represent the past and the assumptions that underpin such representations. While the Chart’s content and methodology may be seen as outdated, its core concept of presenting history as a complex web of interrelated events is more relevant than ever.
In the digital age, we are inundated with vast amounts of historical information. The challenge remains to find effective ways to synthesize and communicate this knowledge to a broad audience. The Synchronological Chart serves as an early precursor to modern digital timelines and infographics, which continue to evolve in their quest to make history more accessible and engaging.
Conclusion
Sebastian C. Adams’ Synchronological Chart or Map of History is a testament to the enduring human endeavor to make sense of the past. Despite its limitations, it offers a unique perspective on the evolution of historical thought and the development of educational tools. As we navigate the complex terrain of historical representation, the Chart stands as a reminder of the importance of critical engagement with our sources and an invitation to continually refine our methods of teaching and learning about the past.
